TMNT: Mutants in Manhattan – lack of accessibility and poor tutorialization

I didn’t want to believe the reviews (e.g., IGN, Gamespot); I really, really, didn’t. The nostalgia and desire for a good TMNT game was just too strong. However, I should have bitten the bullet and quit after the title screen:
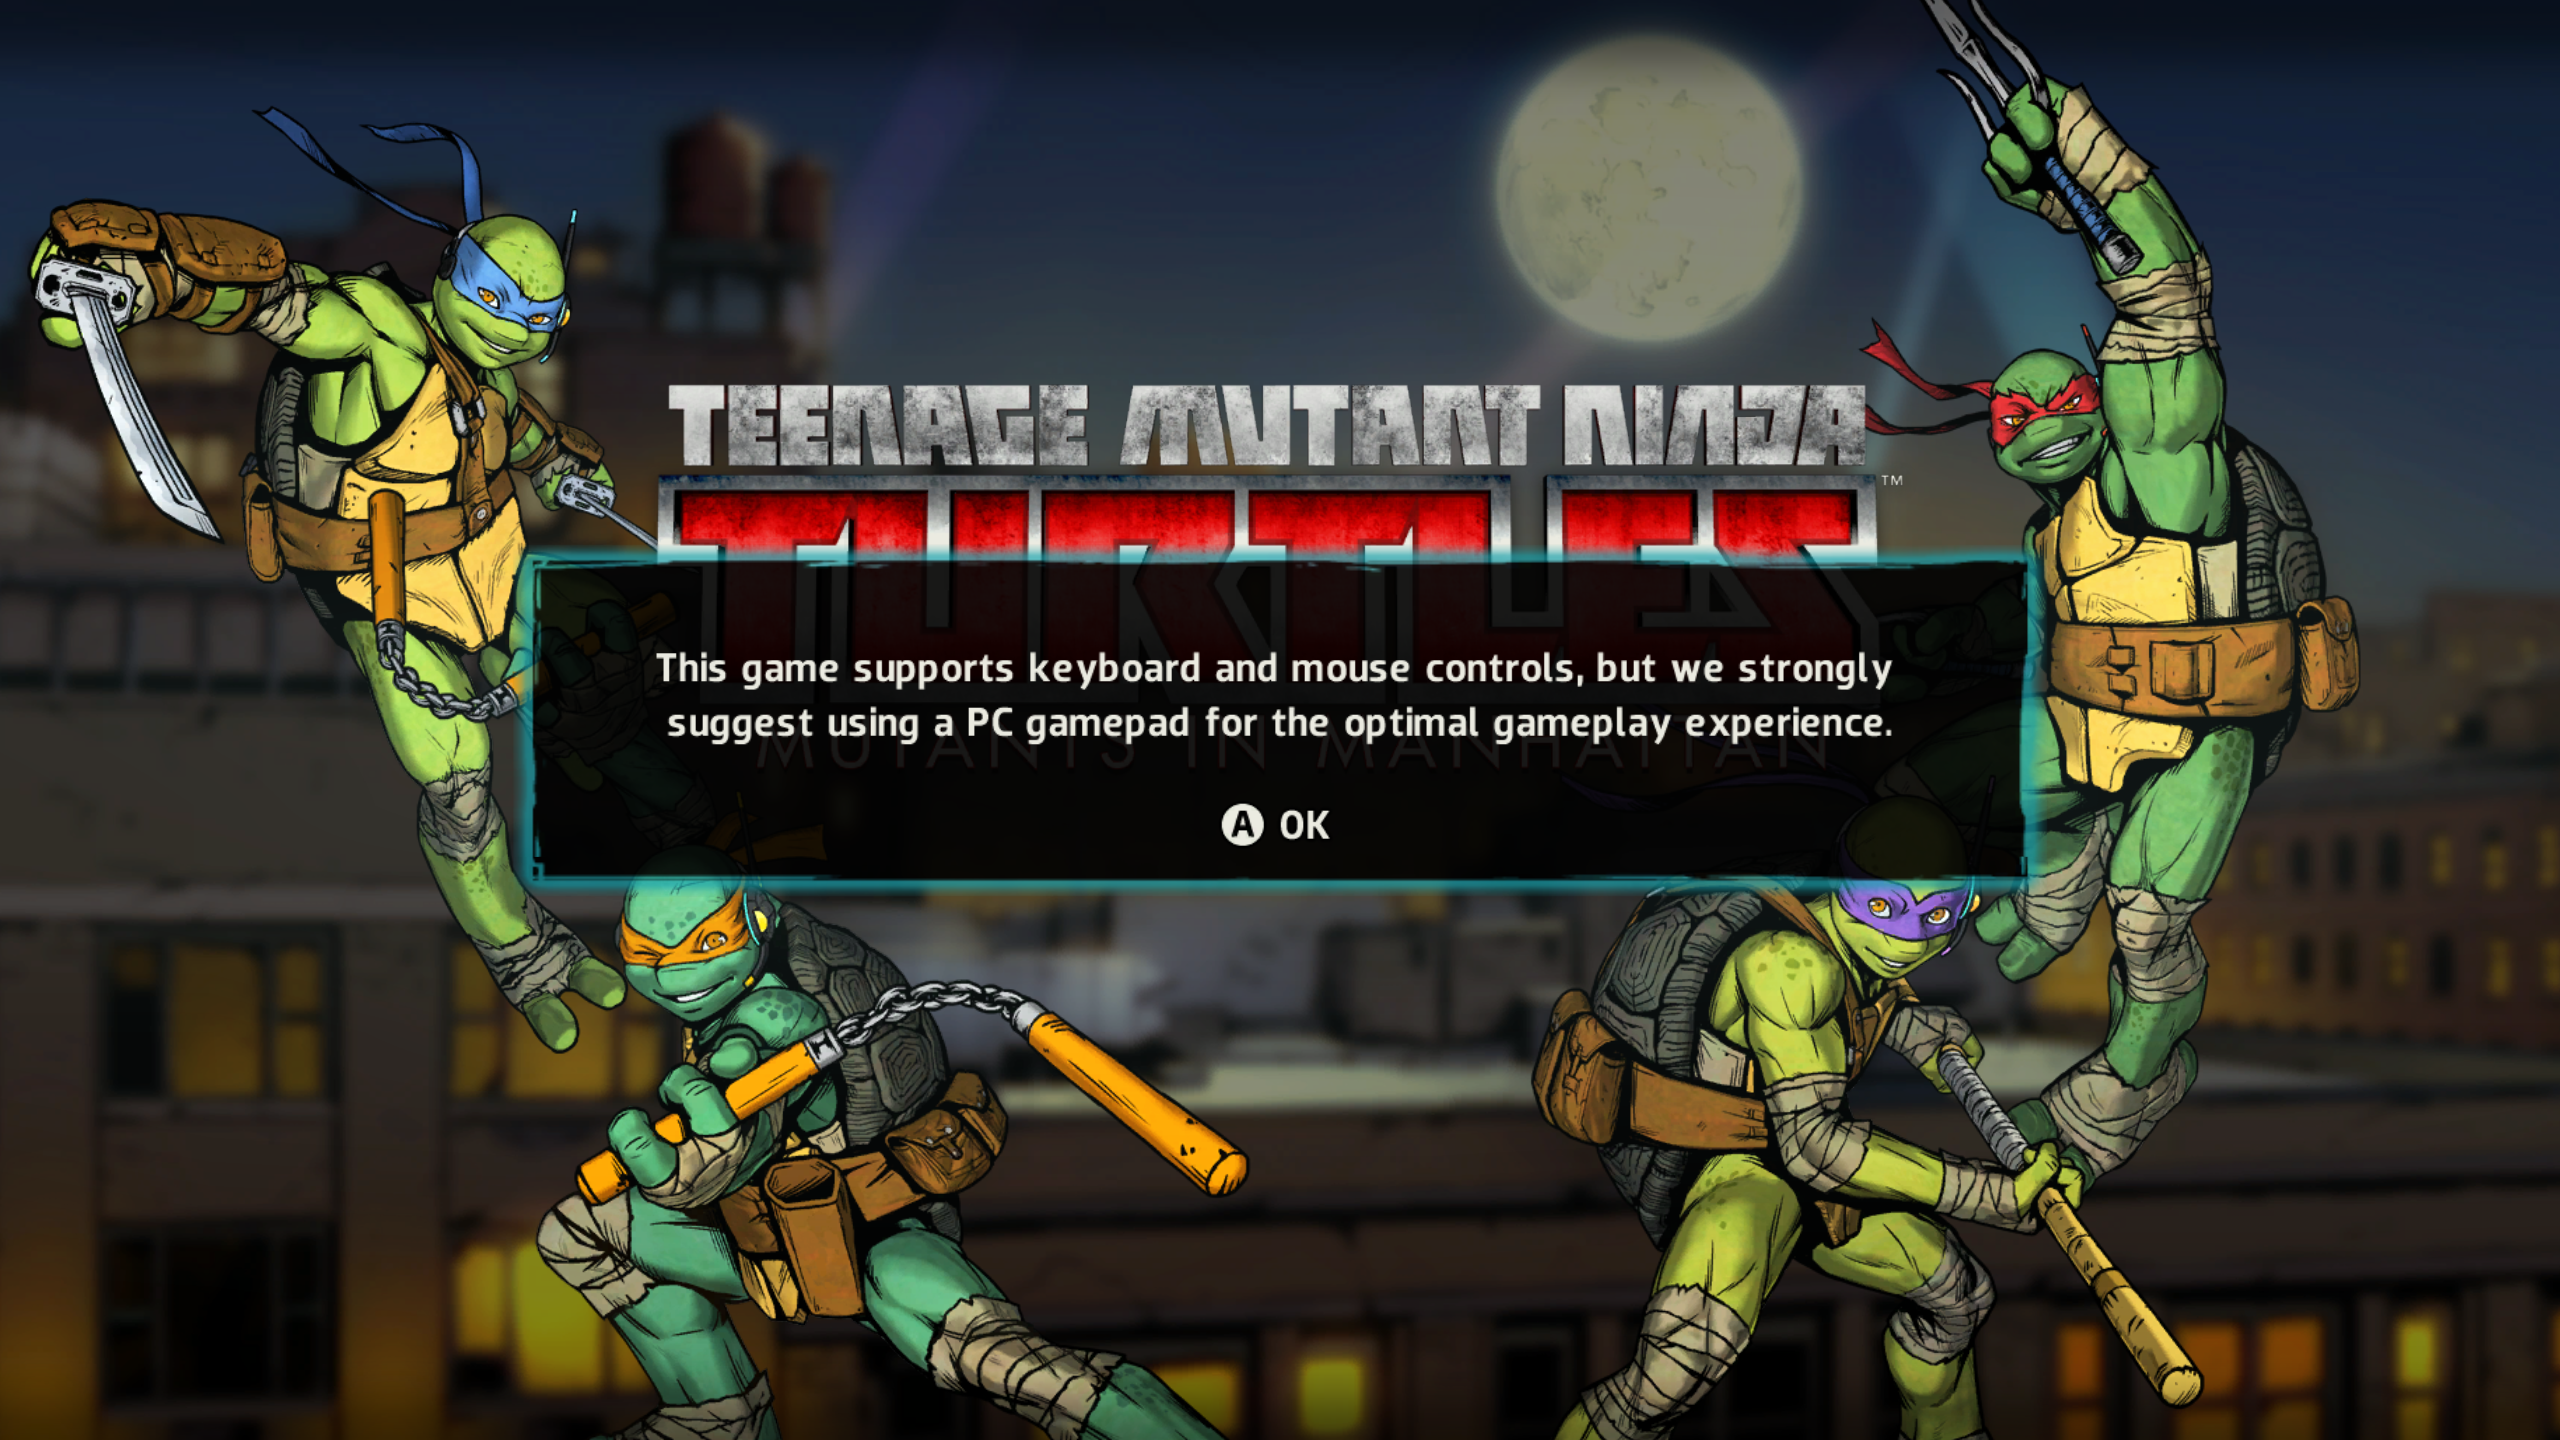
TMNT_MiM 2016-06-21 19-50-11-10

From a usability/accessibility standpoint, this might be the worst possible opening message for a PC game. Luckily, I was able to play with a DS4 controller; otherwise, I wouldn’t have gotten the “optimal gameplay experience.”

Although this issue likely warrants no explanation, a PC game should be optimized for PC controls and controller support should be secondary (although it is a very welcomed accessibility feature). Turning on the game and seeing this screen makes me feel taken advantage of, because this message suggests that the PC version is not well-optimized and less time, money, effort, etc. was allocated to it. Moreover, this completely alienates anyone who plays on PC and does not own a controller from achieving the best possible experience playing this game. Ultimately, this limits accessibility to a game that should be available to a wide audience, ranging from young kids to adults who grew up with TMNT. Immediately, they know they are not playing the best version available, and this could ruin the experience from the outset.

The tutorial room

Another usability issue lies within the tutorial, which is an optional mode that teaches the player all of the necessary controls in a room separate from any in-game action. However, TMNT: Mutants in Manhattan has more than just a few controls to remember, making the tutorial room a less-than-ideal choice for this kind of game. While it’s not overly-complex, it has a surprising amount of controls, ranging from basic movement/combat, to item use, to turtle swapping, to commands, to distinct ninjitsu moves for each turtle. See below for a full playthrough of the tutorial.


A tutorial room that takes almost ten minutes to complete is not beneficial to players here because it is information overload, as there are multiple controls explained followed by gameplay executions for each. More importantly, it’s just plain boring and does not hold the player’s attention, making it even more likely to be skipped altogether, ultimately leaving the player even more confused when playing the actual game and unable to obtain the “optimal gameplay experience.”

Recommendations:

  • Incorporate the tutorial into the first mission of story mode. This will help reduce the likelihood of the tutorial being skipped altogether.
  • Exclude the redundant on-screen text during the tutorial, which is simultaneously being narrated by in-game characters (this requires the player to split his/her attention). Instead, integrate the textual explanations into gameplay diagrams/actions. This will allow the player to learn by doing while likely maintaining his/her focus. Additionally, it can reduce working memory overload for players with less prior knowledge, which likely make up a large percentage of the players for a game with such broad appeal.
  • Break aspects of the tutorial into chunks and present them as they occur organically in the open world. This will require the player to remember less and produce less load on memory. Also, this segmenting will allow him/her to proceed at his/her own pace, granting him/her a greater feeling of control. Ultimately, this will likely lead to less player frustration and a better overall experience.
Updated objective UI

A competitive analysis is an evaluation companies use to to see what similar companies are doing with their products in order to figure out how they can make their product unique and marketable. In games user research, a competitive analysis can be a useful internal tool to help inform game design and different features during many stages of development.

An example:

Company X has been running many internal and external playtests of their current in-development game. They have been noticing a consistent trend of players not realizing when an objective has been updated, completed, and transitioned to a new one. The design team believes this might be an issue with the new objective UI, so a competitive analysis is conducted to see how other games have handled such UI design. This can help give the development team ideas about UI that have worked and not worked for other games, and how they can design theirs to be functional, effective, and consistent with the art direction of the new game. The following are some examples of new objective UI in games that could be presented to the development team for consideration.

Borderlands 2

ezgif.com-video-to-gif

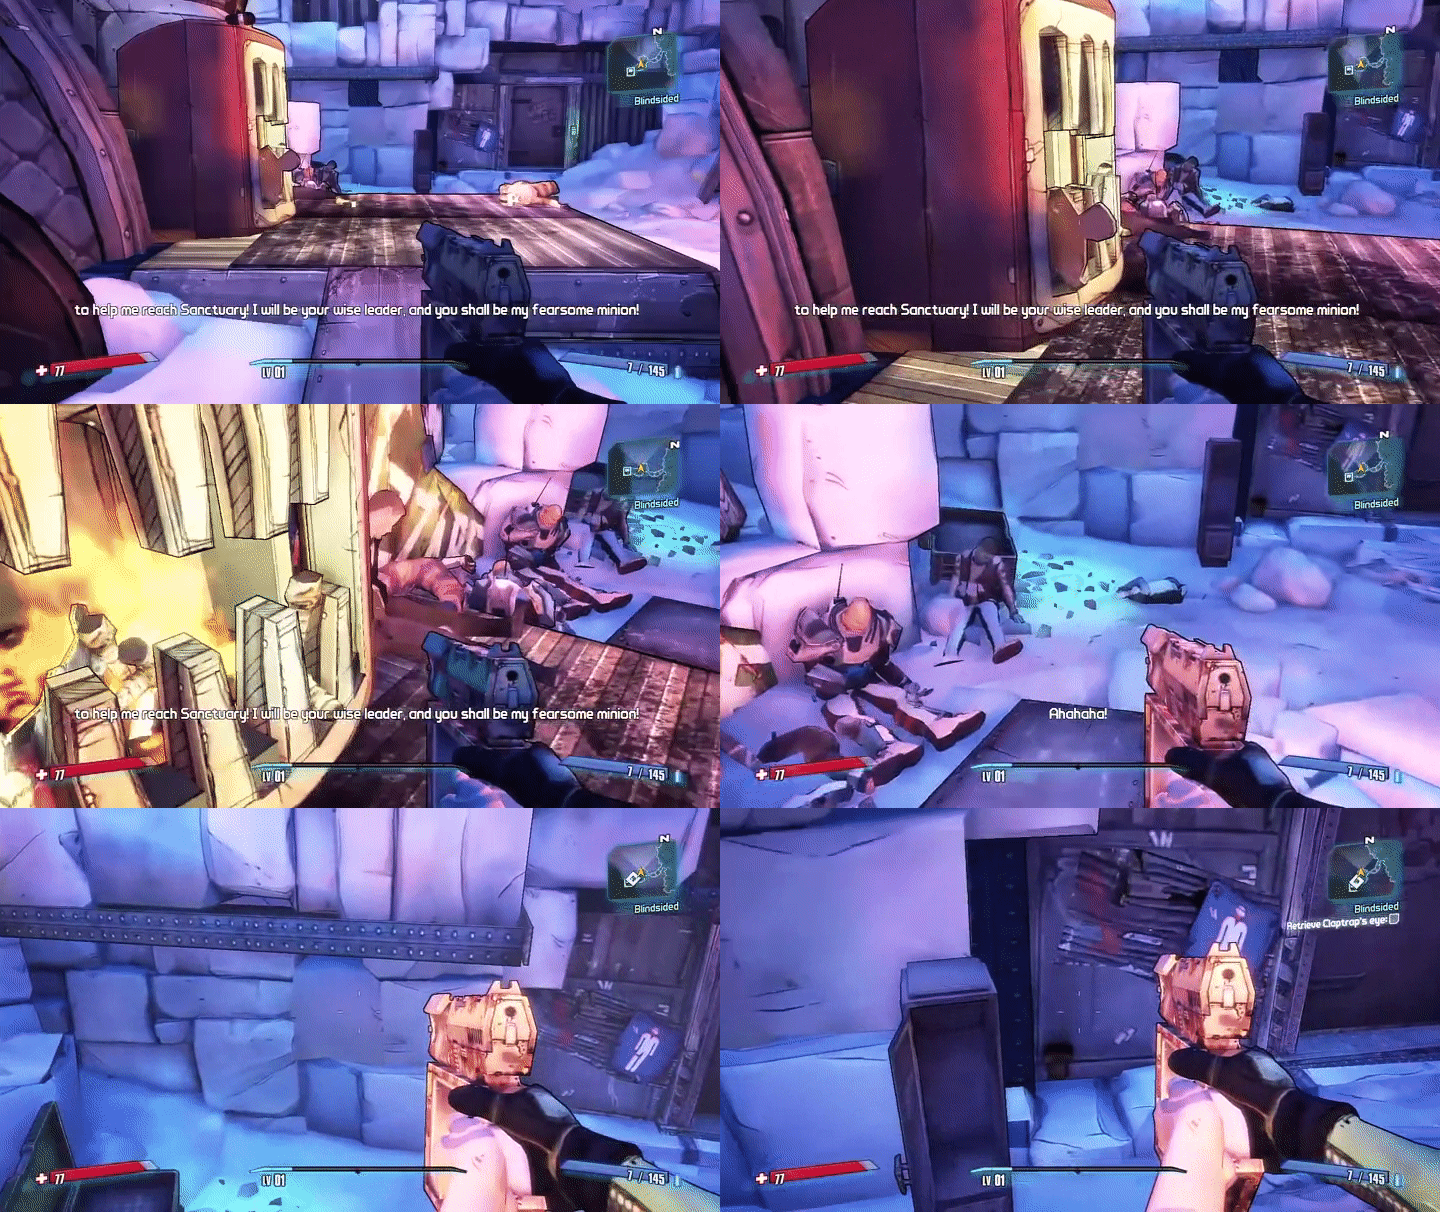
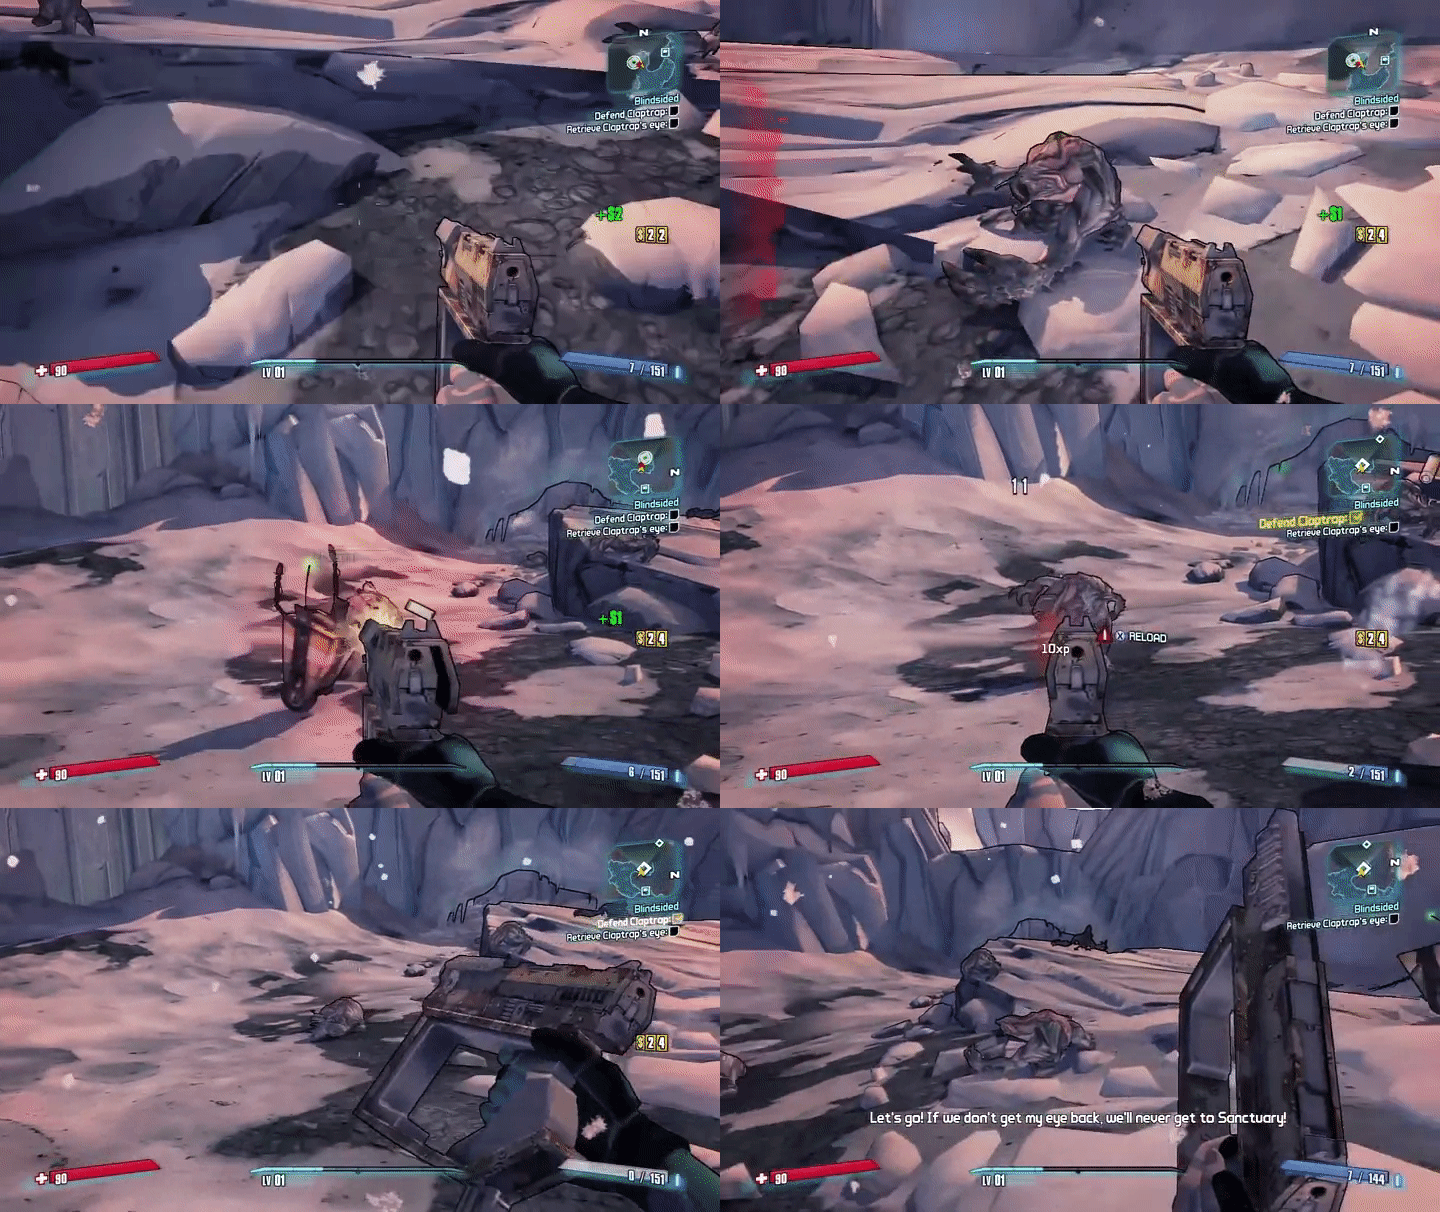
When the player obtains a new objective, the objective text/check box slides onto the upper-right portion of the screen, briefly flashing, and remains under the mini-map.

ezgif.com-video-to-gif (3)

As objectives are completed, they get checked off, flash, and exit the screen.

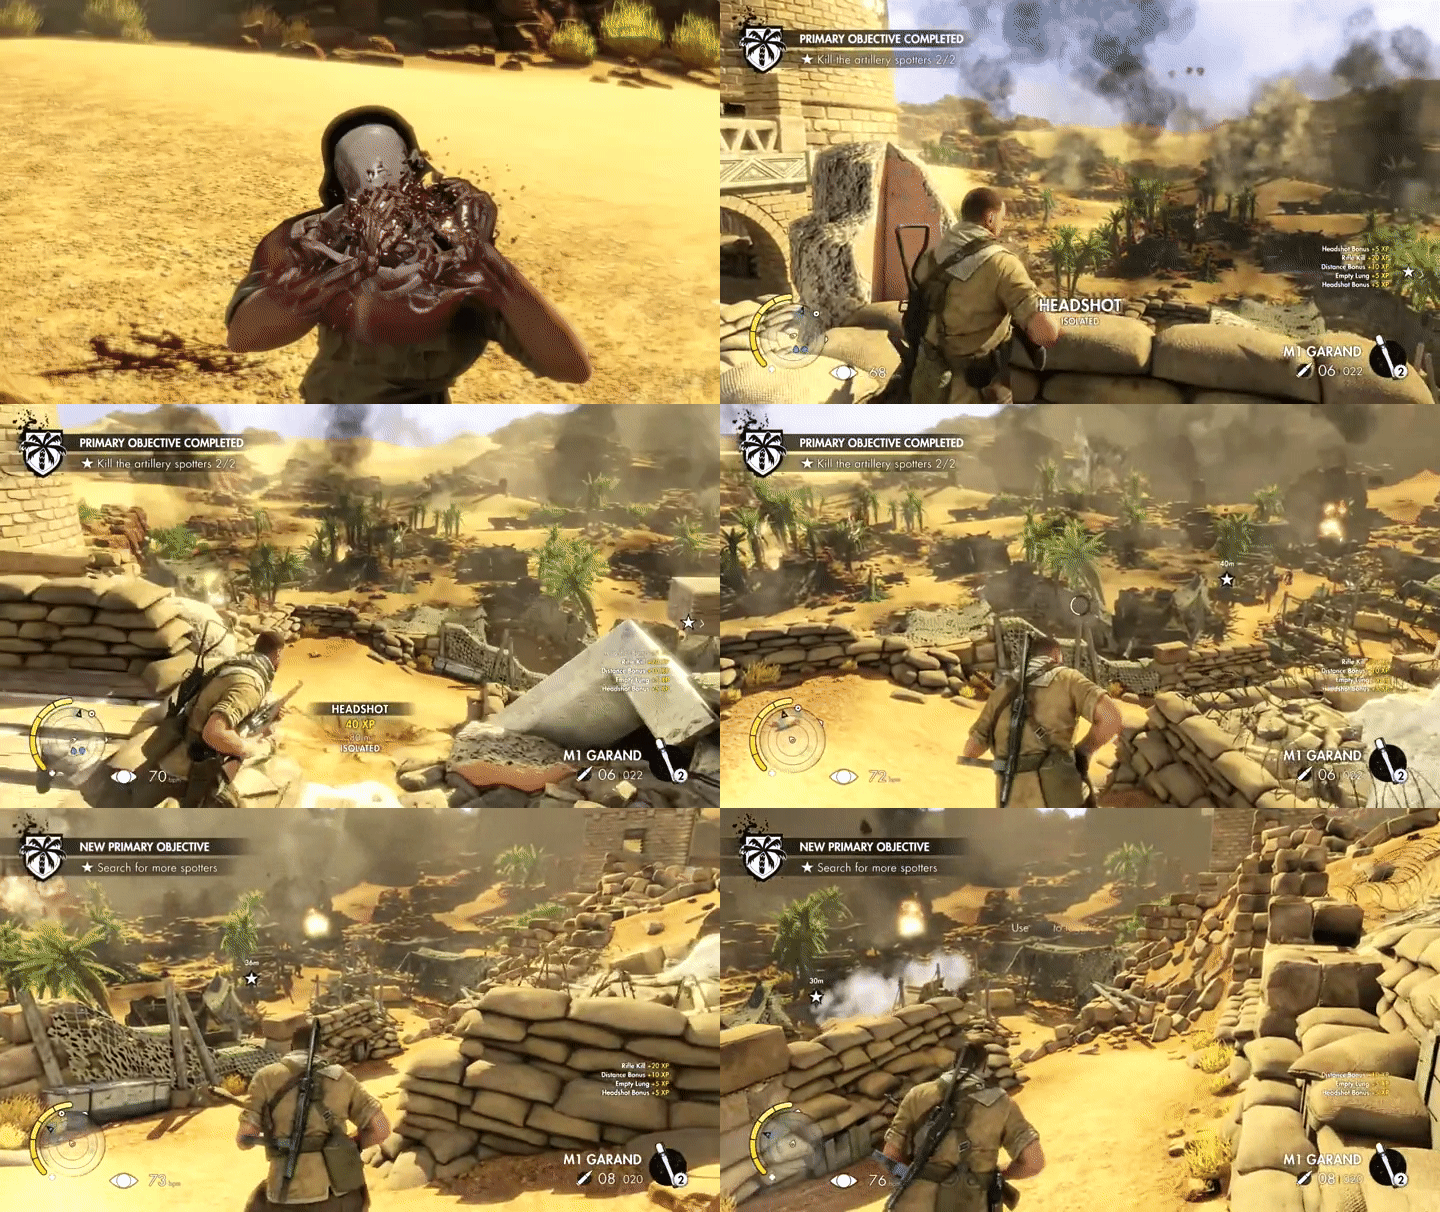
Sniper Elite III

ezgif.com-video-to-gif (2)

Completed and new objectives are indicated by text that appears in the top-left portion of the screen.

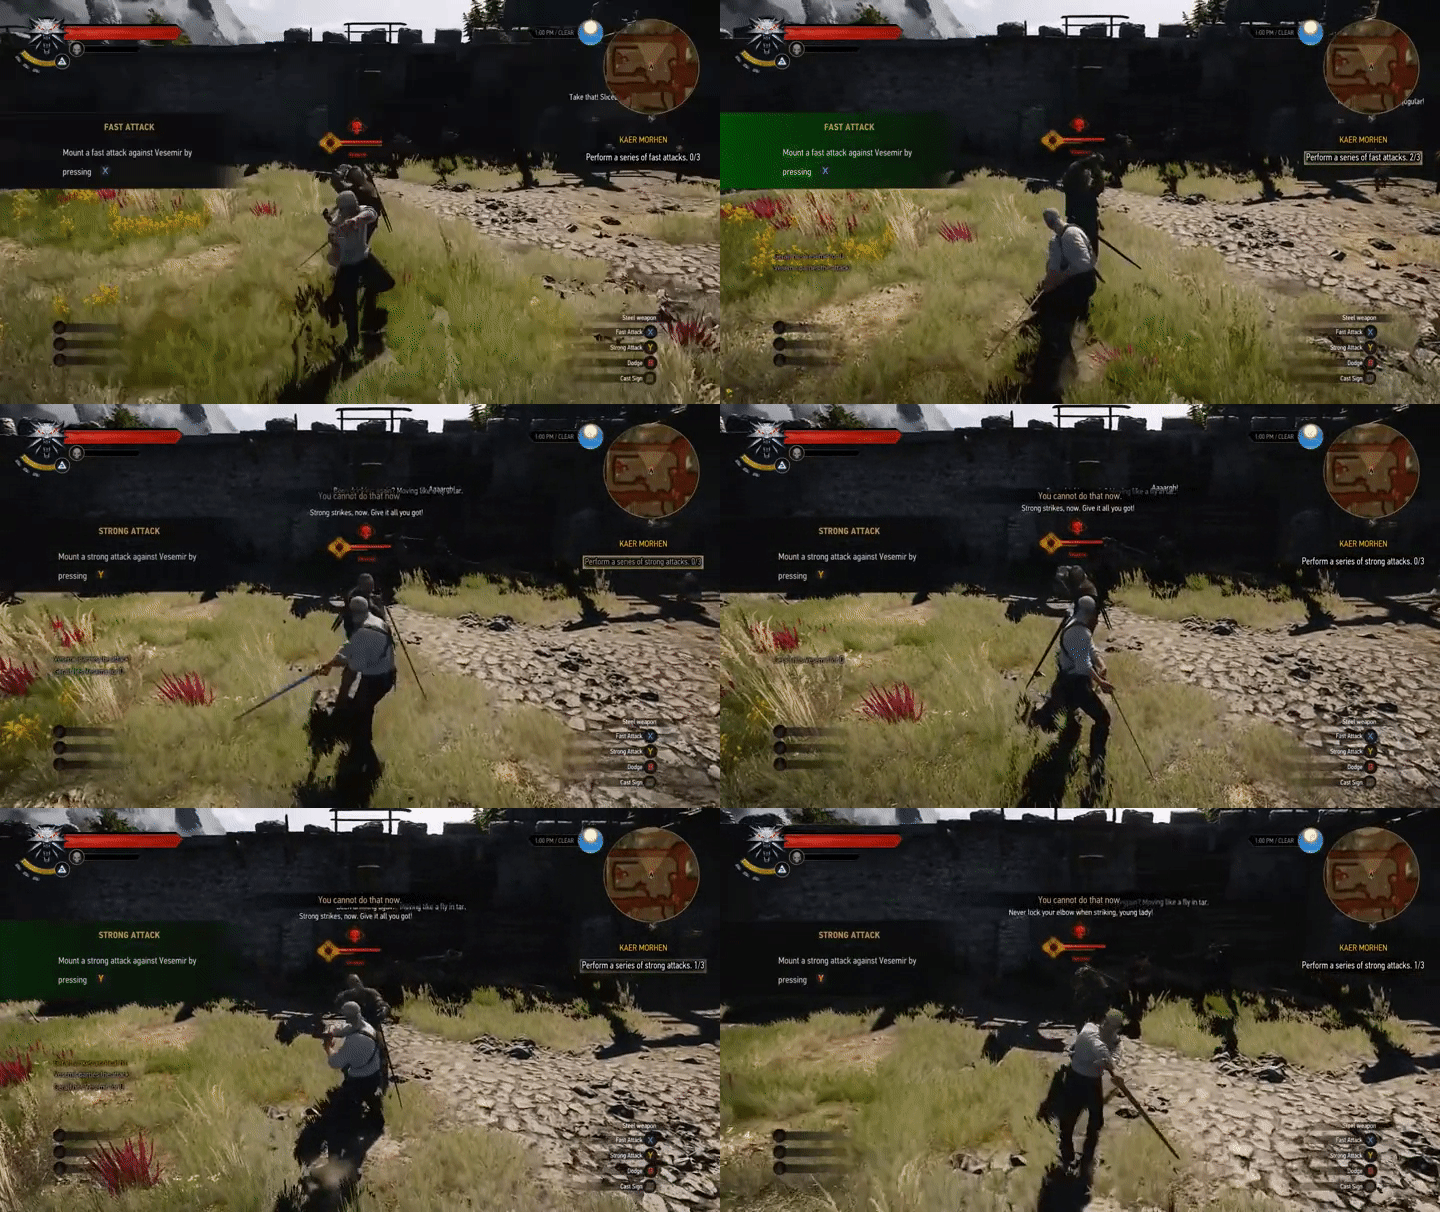
The Witcher 3: Wild Hunt

ezgif.com-video-to-gif (1)

Under the mini-map, the objective is updated as the player completes required portions of the main objective. Relevant text/numbers are updated and the text is highlighted as a cue to the player.

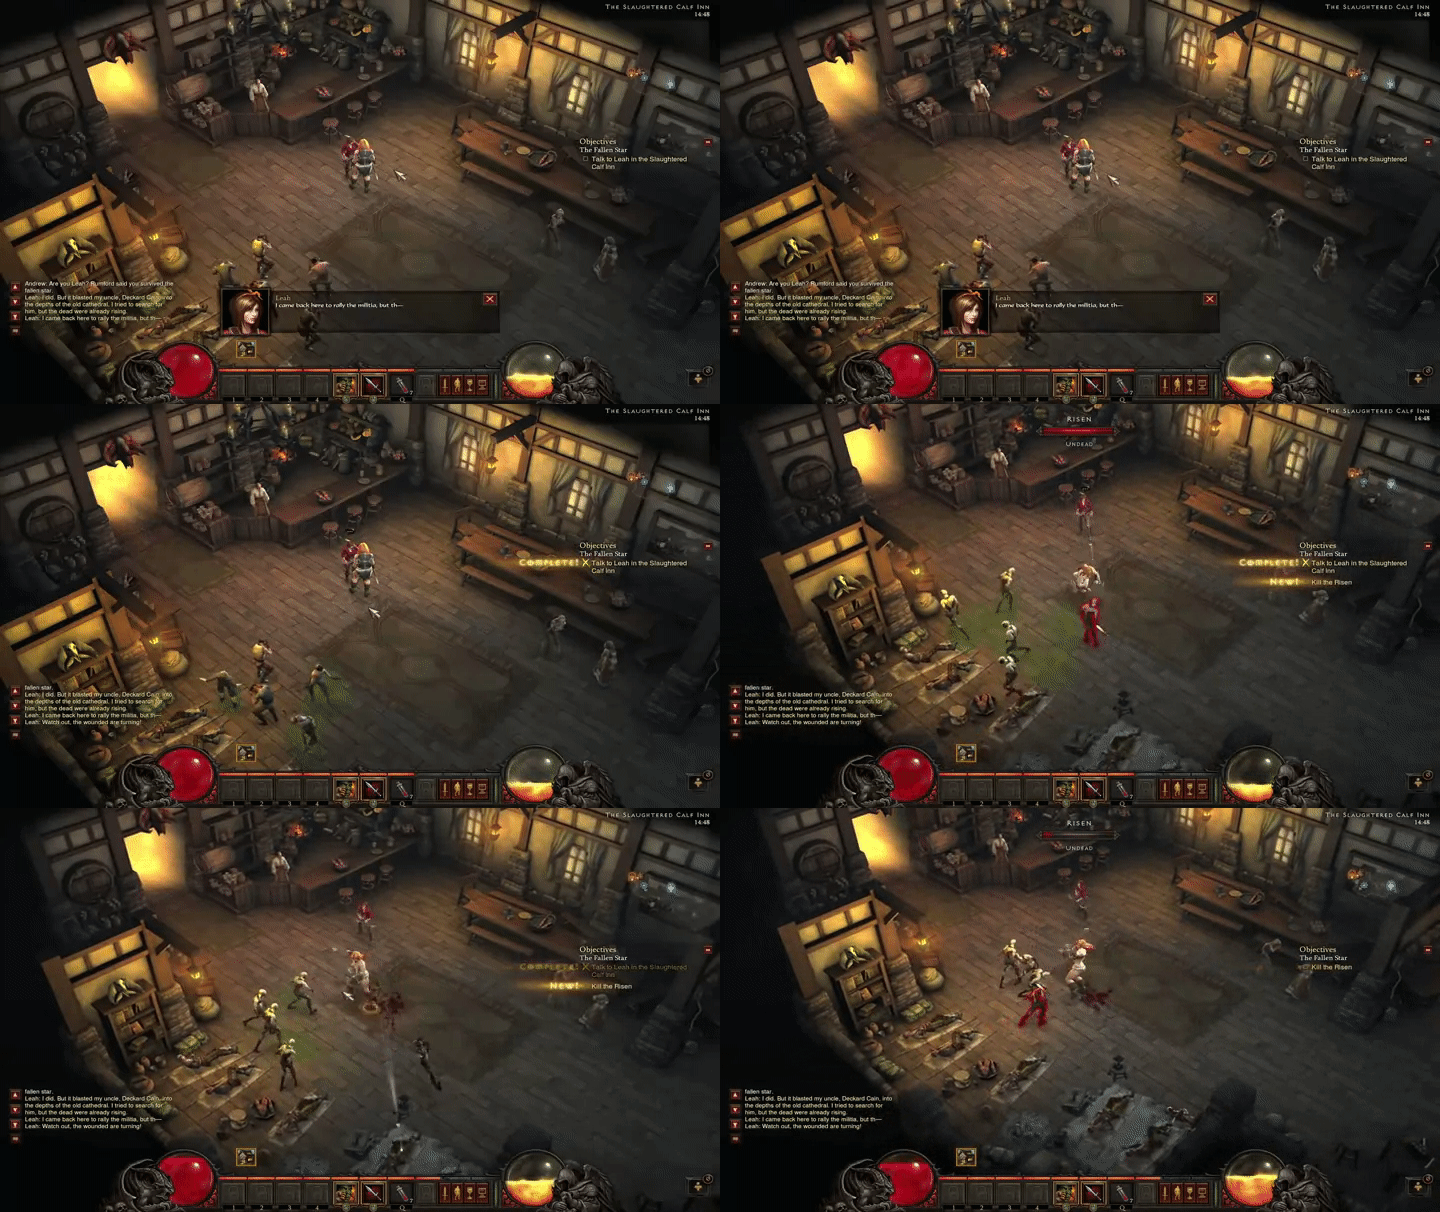
Diablo 3

ezgif.com-gif-maker

Objectives, on the right side of the screen, are updated with a check and a yellow “complete” and “new,” which act as visual cues to notify the player and then fade from the screen.

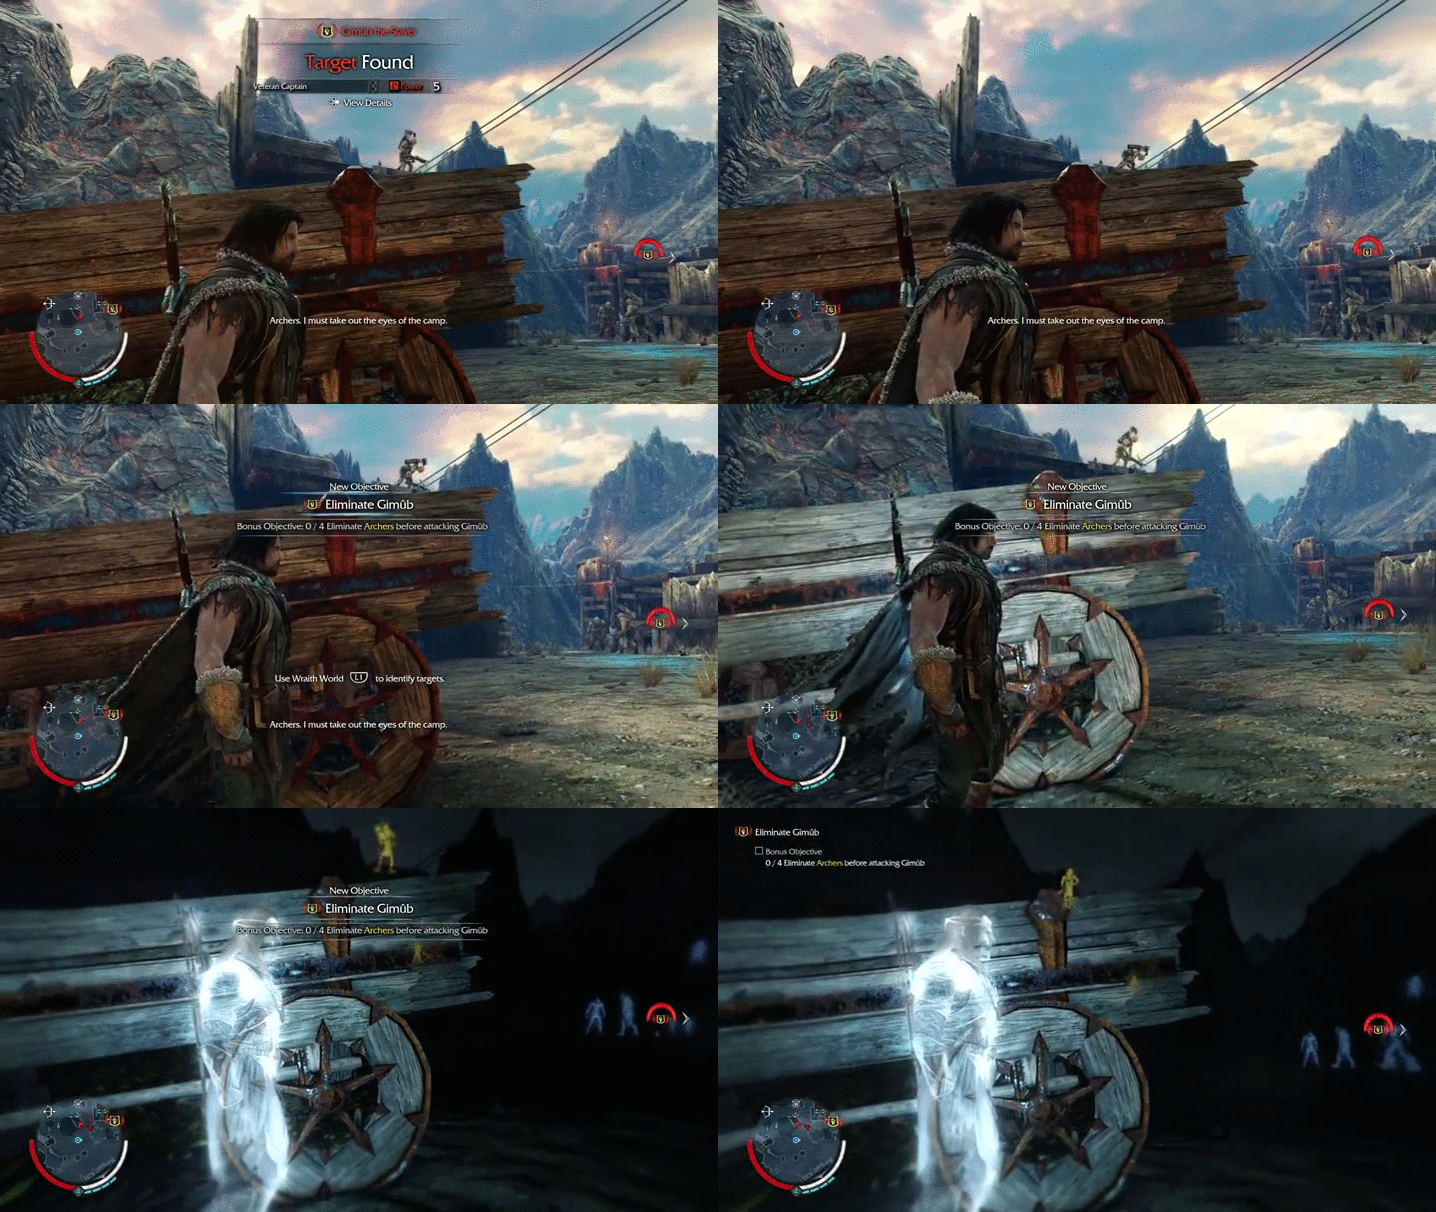
Middle Earth: Shadow of Mordor

Shadows of Mordor

New objective text indicator appears in the center of the screen momentarily before trailing off to the upper-left corner of the screen as a reference for the player.

Conclusion

A report for the development team can be generated, which would include descriptions of the the game-specific features and critical comparisons between the games. Additionally, suggestions for potential directions may be included in the report; however, this would depend on the philosophy of the research department and development team.

This is just one example of a competitive analysis for games user research. Others might include investigating how different games handle blood spatter, damage indicators, or tutorials. A vast knowledge of games is undoubtedly beneficial for such analyses; however, in this digital age with access to YouTube at all times, it is certainly possible to conduct such analyses with little prior knowledge of such specific aspects of different games.

Time spent playing different game modes

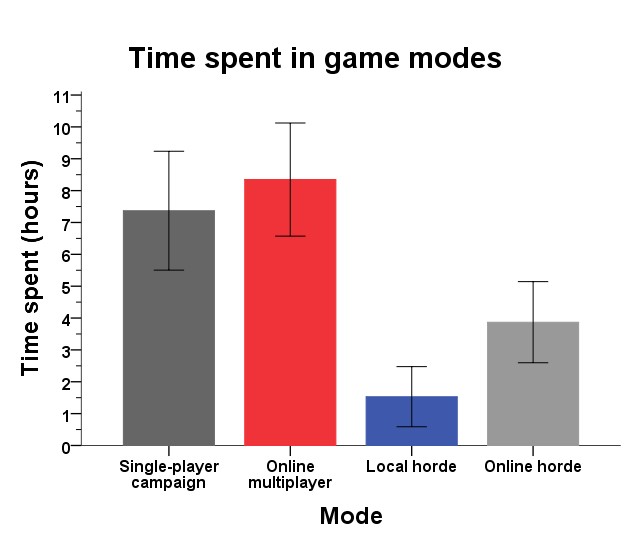
Company X wants to know how long players are spending playing different modes of their new third-person shooter game. The game has four modes: single-player campaign, online multiplayer, and local and online horde modes. An hour before Company X’s weekly update meeting, a researcher is asked to show data representing the time spent (in hours) playing these game modes during the game’s first week following launch from a small random sample of players. A time-spent analysis is important and of interest because it demonstrates what activities/game modes players are engaging in and for how long, which can help guide game development during production as well as post-launch to ultimately see if the game is matching design intention.

The researcher was not worried about generating such data with little prior notice, because Company X collects an exuberant amount of data via telemetry. The figure below was presented along with the statistical analyses of the data, which were paired-samples tests because of the within-subjects design (each group consisted of the same players).

Furthermore, the researcher calculated confidence intervals (the I-shaped bars on the graphs), which are ranges of scores constructed such that the true population will fall within its range in 95% of samples, for each group. The true mean would simply be the average time spent in each of the game modes of every player to play the game during its first week (as opposed to just the small random sample used in this example). Since the researcher doesn’t know the true mean of the entire population of players, he/she doesn’t know if the sample values (means) here are a good or bad estimate of this value. So, rather than fixating on these four means in the sample, the researcher could use an interval estimate instead, utilizing the sample means here as the midpoint, as well as setting a lower and upper limit.

Essentially, the researcher calculated upper and lower limits for each game mode in the sample. Again, since this is only a small sample of the population of the players of Company X’s new game, we do not know the true mean of the population. However, for example, if Company X gathered 99 more different samples of players to generate 99 more figures similar to the one below (and calculated 95% confidence intervals), the researcher could confidently say that in 95/100 of those samples, the true mean of the population of players would fall within that range.

time spent analysis

The small random sample consisted of 23 players and their average time spent in each of the four game modes: single-player campaign, online multiplayer, and local and online horde modes. While the figure alone can show differences visually, further analyses can validate whether there are statistically significant differences between the modes.

Based on this sample, players spent more time, on average, playing single-player campaign (M = 7.37, SE = .900) than local horde mode (M = 1.53, SE = .455). This difference, 5.84 hours, BCa 95% [3.875, 7.803], was significant, t(22) = 6.166, p = .000. Players also spent more time playing single-player campaign than online horde mode (M = 3.87, SE = .614). This difference of 3.5 hours, BCa 95% [1.180, 5.820], was significant, t(22) = 3.128, p = .005.

While there was no significant difference in time spent playing single-player campaign compared to online multiplayer, players spent more time, on average, playing online multiplayer (M = 8.35, SE = .857) compared to local horde mode. This difference of 6.82 hours, BCa 95% [4.727, 8.908] was significant, t(22) = 6.763, p = .000. Players also spent more time, on average, playing online multiplayer than online horde mode; the difference of 4.48 hours, BCa 95% [1.844, 7.013], was significant, t(22) = 3.664, p = .001.

Additionally, players spent more time, on average, playing online compared to local horde mode; the difference of 2.34 hours, BCa 95% [-3.674, -1.004], was significant,  t(22) = -3.634, p = .001.

Conclusion

To summarize, players spent more time playing both single-player campaign and online multiplayer than both local and online horde modes. Additionally, they spent more time playing online horde mode than local horde mode either by themselves or with friends. Again, the confidence intervals are an important piece of information here, because they allow Company X to confidently assume what the true mean of the player population would be for each game mode, and, ultimately, generalize findings based on this small random sample of players.

For more on paired-samples tests and confidence intervals:

Field, A. (2013). Discovering Statistics Using IBM SPSS Statistics. London, England. SAGE.