The Core Elements of the Gaming Experience (CEGE) is a comprehensive model that consists of different factors that, together, form the experience between a video game and its user. The two main umbrella variables associated with the model are Video-Game and Puppetry. Video-Game is simply the game itself, which is broken into the latent (subjective/not measurable) variables of Evironment and Game-play. These latent variables are inferred and are categorized under observable variables; Environment includes graphics and sounds of the game, whereas Gameplay includes the scenario and rules of the game.
Puppetry is the interaction of the player with the video game and is comprised of three main, latent variables: Control, Ownership, and Facilitators. Control is simply “taking control” of the game by learning how to use and manipulate things within it and is comprised of three observable factors: small actions (basic actions the player can do in the game), goal (main objective of the game), and something-to-do (the player needs to feel that there is always something to do in the game). Ownership is when the player takes his action in the game as his own and is ultimately rewarded by the game for them. Ownership is comprised of four observable factors: big actions (strategies used by the player, comprised of many small actions), you-but-not-you (player can take part in actions that he would not necessarily do in real life), personal goals (something not important to winning the game but an action completed for a personal reason), and reward (the game needs to provide the player with rewards). Lastly, Facilitators are external factors that can affect the interaction process between a video game and user and is comprised of three observable factors: aesthetics (how the game looks to the player), time (the time the player is willing to dedicate to the game), and previous experience (previous experiences of the player can affect how long he is willing to play and actions he will take in the game). Ultimately, the observable variables get lumped into the umbrella variables (e.g., gameplay and environment) and, when these umbrella variables of Video-game and Puppetry are met, the ultimate player experience/enjoyment is achieved.
The CEGE model has been operationalized and made into a standardized 38-question questionnaire that touches upon all of the previously discussed factors. Each question is rated on a 1-7 Likert scale (1 = completely false, 7 = completely true for this demonstration). Here two examples from the questionnaire:
25. I knew how to manipulate the game to move forward (puppetry – control/ownership)
26. The graphics were appropriate for the type of game (video-game – environment)
With the CEGE model now briefly explained, we will look at a mock data set utilizing it. For the sake of this analysis, we will pretend that Company X is interested in testing the user experience of one of its games during multiple stages of development. Right from the beginning of the conceptual stage, they have planned to utilize the CEGE model to test during prototyping as well as both the alpha and beta stages of production. Company X will also implement other forms of usability testing that will help them incorporate necessary changes to the game during these development phases. They are hypothesizing that average CEGE scores will increase with each phase because they will be able to address player’s feedback from other usability tests in between stages before testing again. For this study, they recruited a total of 33 participants, 20 males and 13 females (average age of 18.606 years), and 11 different participants were tested during each stage. To test whether there was a change in CEGE scores over time, they used a one-way between-subjects ANOVA. The alpha level was .05 two-tailed. Here is what they found:
Results
Overall CEGE score
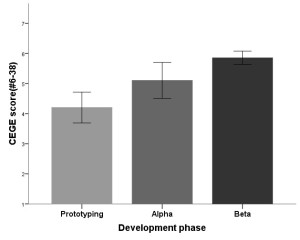
The one-way between-subjects ANOVA revealed a significant effect of development phase on overall CEGE score, F(2, 30) = 12.303, p = .000, indicating that, on average, there were differences in CEGE scores during the testing phases. Post hoc comparisons using the Tukey HSD test indicated that the mean CEGE score for the prototyping phase (M = 4.203, SD = 8.502) was lower than the mean CEGE score during both alpha (M = 5.104, SD = .987; p = .030) and beta (M = 5.856, SD = .371; p = .000) phases; however, while CEGE scores during the alpha phase were lower than those during the beta phase, the difference only trended toward significance (p = .078). Taken together, these results indicate that CEGE scores did indeed improve with each successive testing phase, suggesting that Company X addressed issues encountered by players during earlier testing phases, ultimately producing better experiences.
Enjoyment
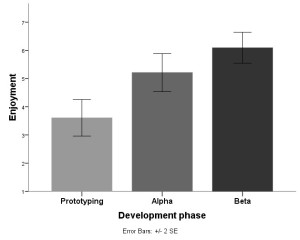
The pattern of results for Enjoyment scores is similar to that of the CEGE scores. There was a significant effect of development phase on Enjoyment scores, F(2, 30) = 16.240, p = .000, indicating that, on average, there were differences in scores on questions related to Enjoyment during the testing phases. Post hoc comparisons indicated that the mean Enjoyment score for the prototyping phase (M = 3.605, SD = 1.073) was lower than the mean Enjoyment score during both alpha (M = 5.211, SD = .1.118; p = .003) and beta (M = 6.090, SD = .9078; p = .000). However, Enjoyment scores during the alpha phase were not significantly lower than those during the beta phase (p = .133). Together, this suggests that changes made to the game following testing during prototyping had a positive effect on enjoyment scores; however Company X did not see that same improvement between alpha and beta testing.
Frustration
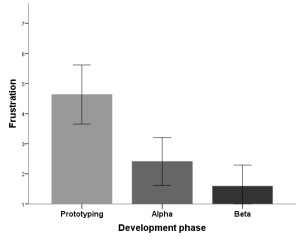
The opposite pattern of results was true for Frustration scores. There was a significant effect of development phase on Frustration scores, F(2, 30) = 14.291, p = .000, indicating that, on average, Frustration scores differed during the different testing phases. Post hoc comparisons indicated that the mean Frustration score for the prototyping phase (M = 4.636, SD = 1.629) was higher than the mean Frustration score during both alpha (M = 2.409, SD = 1.319; p = .002) and beta (M = 1.590, SD = .1.157; p = .000). However, Frustration scores during the alpha phase were not significantly higher than those during the beta phase (p = .360). Taken together, this suggests that changes made to the game following testing during prototyping made the game significantly less frustrating to players; however, the game was not any less frustrating to players following changes made between alpha and beta phases.
Puppetry (ownership)
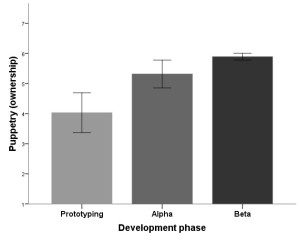
While there were no significant differences in Puppetry (control) scores between the three development phases, there was a significant effect of development phase on Puppetry (ownership) scores, F(2, 30) = 16.366, p = .000, indicating that, on average, there were differences in scores on questions related to Ownership during the testing phases. Post hoc comparisons indicated that the mean Ownership score for the prototyping phase (M = 4.029, SD = 1.100) was lower than the mean Ownership score during both alpha (M = 5.317, SD = .769; p = .002) and beta (M = 5.893, SD = .186; p = .000). However, Ownership scores during the alpha phase were not significantly lower than those during the beta phase (p = .212). Altogether, this indicates that changes made to the game following testing during prototyping had a positive effect on the players’ feeling of ownership of the game; however players’ feelings of ownership did not improve between alpha and beta testing.
Puppetry (control/ownership)
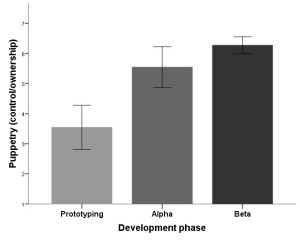
Additionally, there was a significant effect of development phase on Puppetry (control/ownership) scores, F(2, 30) = 22.209, p = .000, indicating that, on average, there were differences in scores on questions related to Control/Ownership during the testing phases. Post hoc comparisons indicated that the mean Control/Ownership score for the prototyping phase (M = 3.545, SD = 1.213) was lower than the mean Control/Ownership score during both alpha (M = 5.545, SD = .1.128; p = .000) and beta (M = 6.272, SD = .467; p = .000). However, Control/Ownership scores during the alpha phase were not significantly lower than those during the beta phase (p = .216). Taken together, these results suggest that changes made to the game following testing during prototyping improved scores related to the players’ feelings of control and ownership of the game; however there was no change from alpha to beta phases.
Video-game (gameplay)
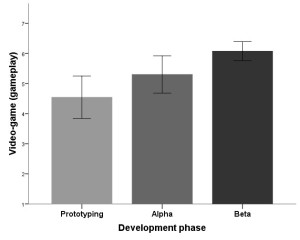
Although there were no differences between the three development phases on Video-game (environment) scores, there was a significant effect of development phase on Video-game (gameplay) scores, F(2, 30) = 7.165, p = .003, indicating that, on average, there were differences in scores on questions related to gameplay during the testing phases. Post hoc comparisons indicated that the mean gameplay score for the prototyping phase (M = 4.545, SD = 1.166) did not significantly differ from the gameplay score during alpha (M = 5.302, SD = 1.027; p = .164) testing; however, gameplay scores during prototyping were significantly lower than those during the beta (M = 6.075, SD = .529; p = .002) phase. Furthermore, gameplay scores were not significantly different between the alpha and beta phases (p = .153). Altogether, these results indicate that gameplay scores improved from prototyping to beta testing; however, there were no improvements in gameplay scores from prototyping to alpha and alpha to beta testing phases, suggesting that Company X had to wait until after beta testing to see significant increases in gameplay scores due to their changes throughout the development phases.
Discussion
Using the CEGE model and questionnaire, Company X was able to objectively reveal important information on factors related to different aspects of players’ experiences, such as video-game environment and gameplay, enjoyment, frustration, control, and ownership when playing their game. When combined with other forms of usability testing throughout the development process, the CEGE model can offer invaluable insights into how the usability changes implemented by Company X have ultimately affected player experience.
In the current study, some obvious patterns of results emerged from the data. Primarily, overall CEGE scores, which take into account questions 6-38 on the questionnaire, improved with each testing phase. This is an important finding because it encompasses many of the factors that influence player experience and, broadly, shows Company X that the changes they have made to their game, based on other usability tests, have improved overall player experience.
A secondary pattern that emerged was the improvement of scores from prototyping to alpha phase; however, there were no significant improvements in these scores between alpha and beta phases. Although the graphs show increases in the scores, and decreases when considering Frustration, from alpha to beta testing, these differences were not significant due to the variability in the data. This was true of all the other factors where there were differences between prototyping and alpha, including Enjoyment, Frustration, Puppetry (ownership, control/ownership), and Video-game gameplay. Overall, this indicates that changes implemented by Company X between prototyping and alpha produced improvements in these areas of player experience; however, changes made between alpha and beta did not result in improvements in enjoyment, frustration, ownership, control/ownership, and gameplay. This is likely less important to Company X because smaller-scale/less significant changes were likely made between alpha and beta, compared to prototyping and alpha phases. Importantly, players enjoyed the game significantly more from the initial testing (prototyping) to final testing (beta), which was the ultimate goal of Company X. Additionally, the frustration levels of players decreased between these phases, indicating that the changes implemented were positive in terms of player experience. Furthermore, players had an increased sense of ownership and control/ownership between prototyping and beta phases, suggesting that changes made by Company X allowed the players to feel like they were in better control of the game by having a better understanding of the basic controls, main goals, and always feeling that there was something to do. Similarly, players had an improved sense ownership, which included incorporating more strategy into their gaming, as well as completing actions based on personal goals and actions they would not perform in real life. This caused players to seek rewards for their actions in the game, ultimately allowing players to take ownership of their in-game actions. Lastly, there were no differences in Video-game environment, likely because Company X did not make any changes to the graphics or sound of the game during these three development phases. However, there were changes from prototyping to beta phase in regards to gameplay, indicating that Company X changed some aspects of the game’s general rules and scenario to cater to participants’ feedback, resulting in a better overall experience.
With this mock data analysis, an example of how a company can objectively measure variables that are related to the player experience using the CEGE model has been demonstrated. Along with other types of usability/user experience testing, this model can provide insightful information related to how a game can be modified in order to provide a better overall player experience.
For a more thorough review of the CEGE model, see Chapter 3 of Game User Experience Evaluation.