Company X wanted to predict how certain variables affect how many copies of their game sell. They believed a specific, single, variable would be the strongest predictor of game sales, so they compiled data related to the marketing budget for their last 100 games (yeah, they’ve been busy) and calculated a simple linear regression to predict the number of game sales (in millions) based on budget allotted to marketing (in millions).
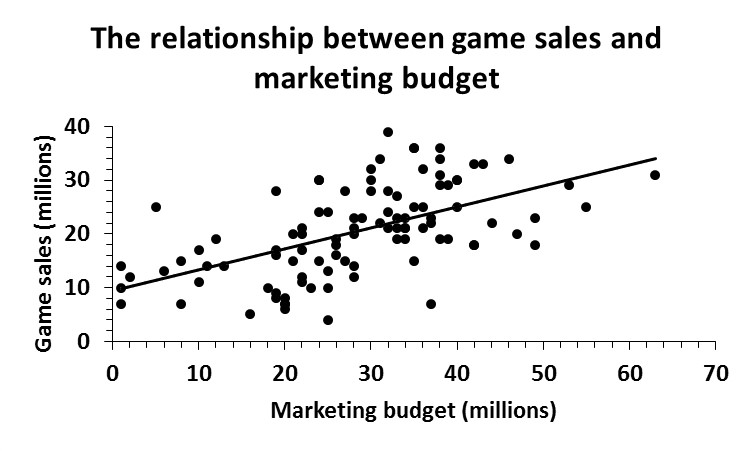
A significant regression was found F(1, 98) = 46.662, p = .000, with an R² of .323, which tells us that marketing budget can account for about 32% of the variation in game sales, meaning that their model cannot explain 68% of the variation, which is explained by other variables. The following equation can be derived from the analysis: the predicted amount of game sales is equal to 9.342 + .391 (marketing budget) million when the marketing budget is measured in millions. Average game sales increased .391 million for each million allotted to the marketing budget. Additionally, as seen in the graph above, there was a strong, positive correlation (R = .568) between marketing budget and game sales, indicating that, on average, the more Company X spent on funding marketing for their games, the more copies were sold.
While Company X was pleased to see that putting money into marketing their games had a positive relationship with game sales, they were interested in incorporating another variable into their model in an attempt to explain more than the 32% of variability in game sales. Therefore, they added the budget allotted to usability testing for each of the 100 games and, theoretically, thought that the amount of money allotted to usability testing, which provided a better overall user experience, might impact how many copies were ultimately sold.
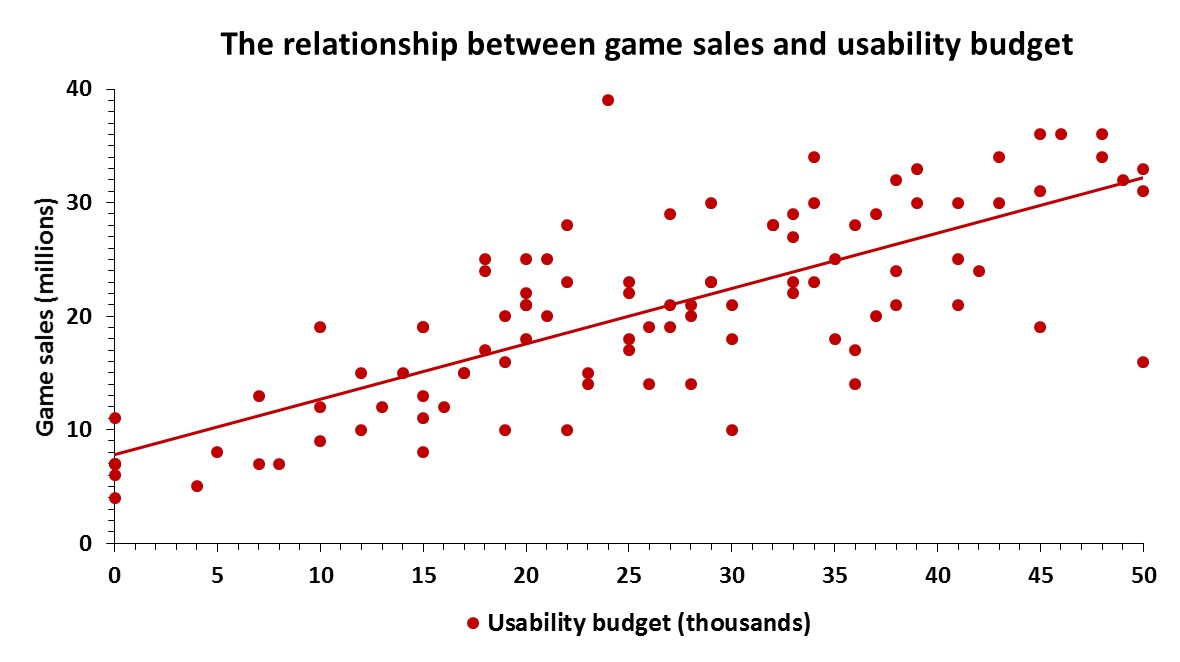
A significant multiple regression was found F(1, 98) = 90.465, p = .000, with an R² of .651, which tells us that, together, marketing and usability budgets can account for about 65% of the variance in game sales, meaning that adding the usability budgets to the model explained about 33% (R² change = .328) more of the variability in game sales. Therefore, the predicted amount of game sales is equal to 4.382 + .194 (marketing) + .408 (usability), where marketing is measured in millions and usability is measured in thousands. Game sales increased .194 million for each million spent on marketing and .408 million for each thousand spent on usability testing. Additionally, as seen in the graph above, there was a strong, positive correlation (R = .767) between usability budget and game sales, indicating that, on average, the more Company X spent on funding usability testing for their games, the more copies were sold.
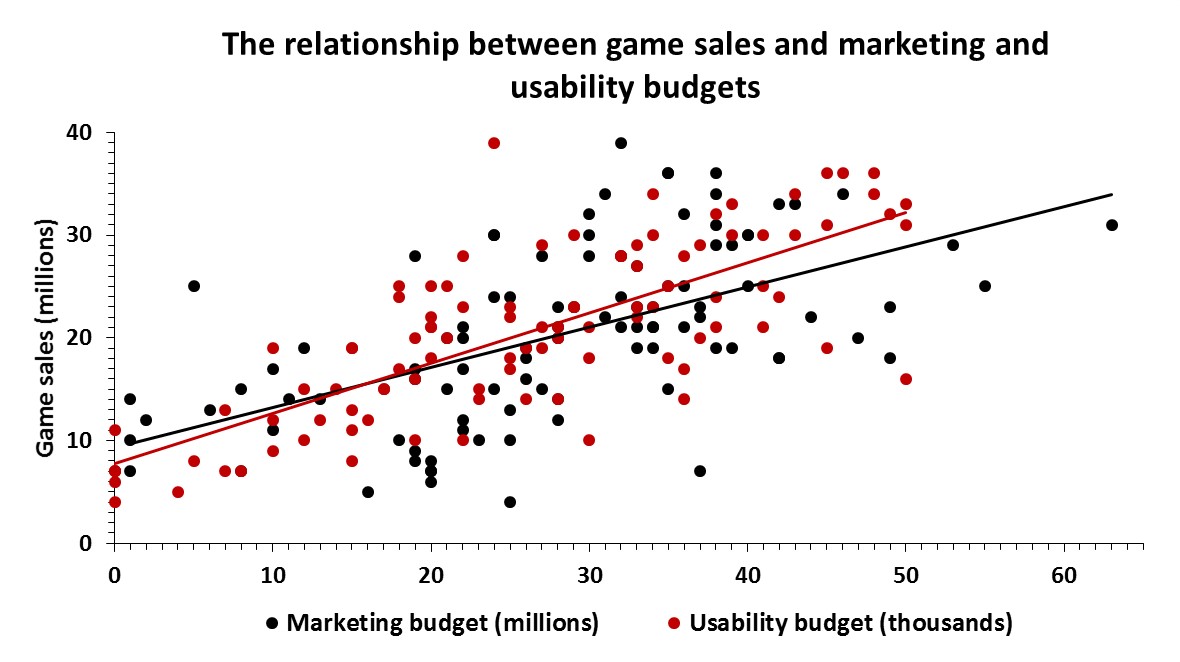
Both marketing budget (p = .000) and usability budget (p = .000) were significant predictors of game sales. Importantly, the adjusted R² (.644) was very similar to that of the model, indicating that, if the model were derived from the population rather than this sample, it would account for approximately .7% less variance in game sales. For comparison, below, you can see a combination of the previous two graphs with trendlines for each predictor.
Conclusion
It is important to keep in mind that these are mock analyses and the data is purposely fabricated to show specific results. Additionally, there are multiple ways of conducting multiple regression analyses, and one important manipulation is how predictors are entered into the model, which can greatly affect the outcome. Here, Company X began by conducting a simple linear regression to investigate the relationship between game sales and marketing budget. Although it was a significant predictor of game sales, the marketing budget of their games only explained about 32% of the variance in game sales. So, they added another predictor variable they thought might have a positive relationship with game sales, usability budget, and found that, when combined with marketing budgets, usability budgets explained 65% of the variance in game sales. This is a much better explanation of the variance compared to the 32% explained solely by marketing budgets. Therefore, while Company X realizes the importance of marketing their games, they now know there is a significant, positive, relationship between how much of their budget is allotted to usability testing and will continue these practices with future games in hopes of continuing their impressive sales record.